
As the UK’s communications regulator, Ofcom receives complaints from customers about their landline, fixed broadband, pay-monthly mobile and pay-TV services.
To better understand the reasons for dissatisfaction among residential customers in our sectors, we compile that data and determine the number of complaints received by provider and by service. To compare the performance of providers, on a quarterly basis we publish the number of complaints that we received about them relative to the size of their customer bases (i.e. per 100,000 customers).
Overall trends
In the quarter from July to September 2024 (Q3 2024), the number of complaints to Ofcom decreased slightly from the previous quarter (Q2 2024: April to June), however the overall level of industry complaints stayed broadly the same compared to the previous quarter.
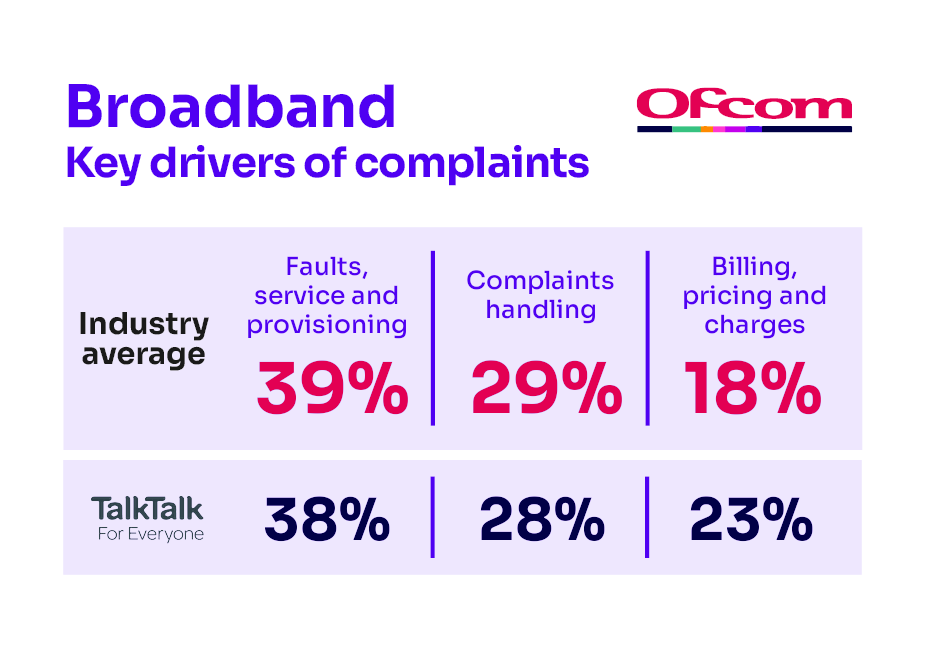
- TalkTalk generated the most fixed broadband complaints. Complaints about TalkTalk saw an increase from the previous quarter.
- Sky was the least complained about fixed broadband provider.
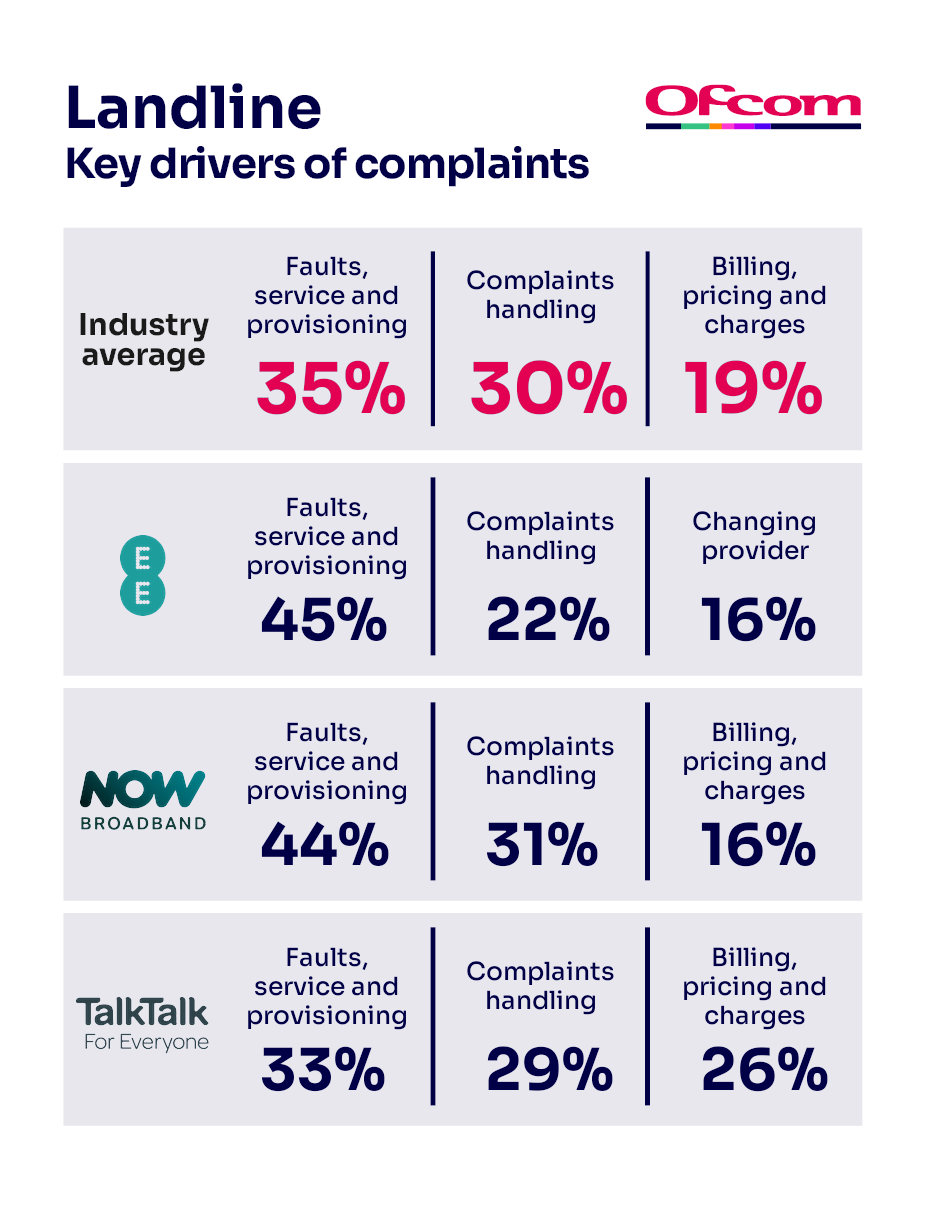
- EE, NOW Broadband and TalkTalk generated the most landline complaints. EE saw a decrease, NOW Broadband saw a decrease, and TalkTalk saw an increase in their complaints per 100,000 subscribers compared to the previous quarter.
- Utility Warehouse was the least complained about landline provider.
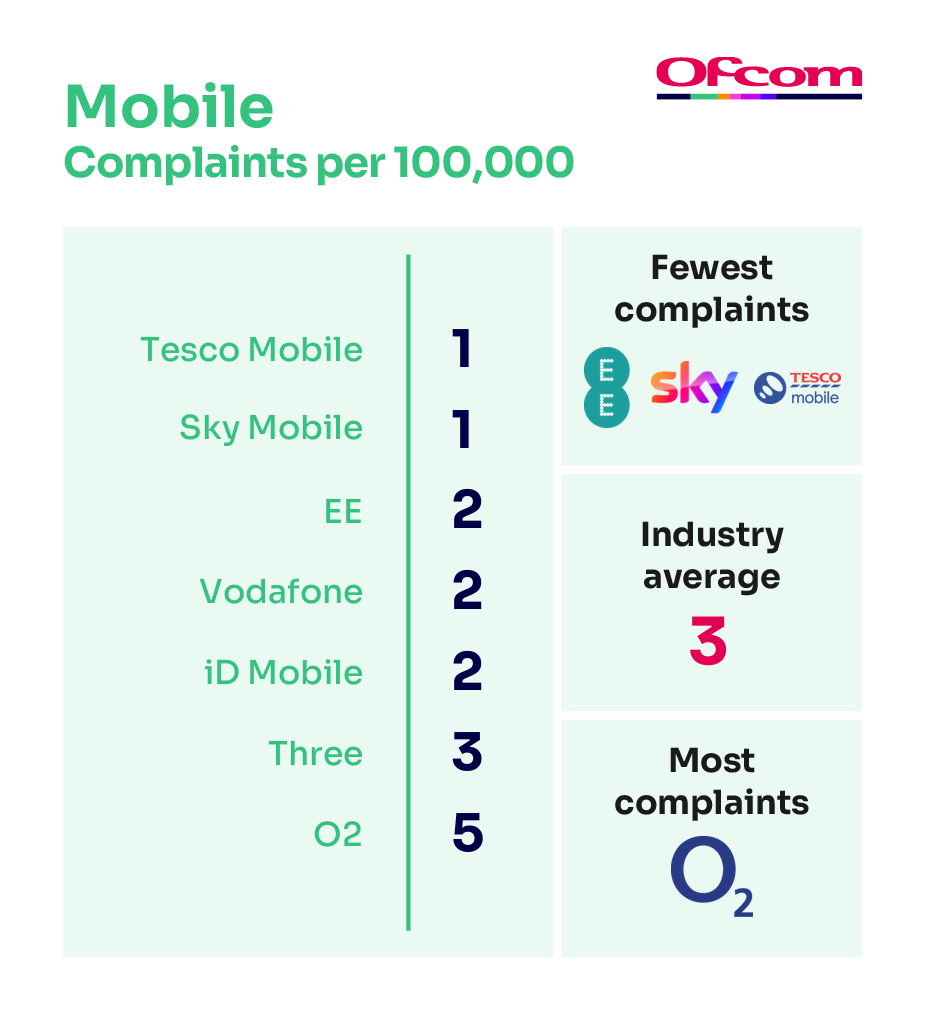
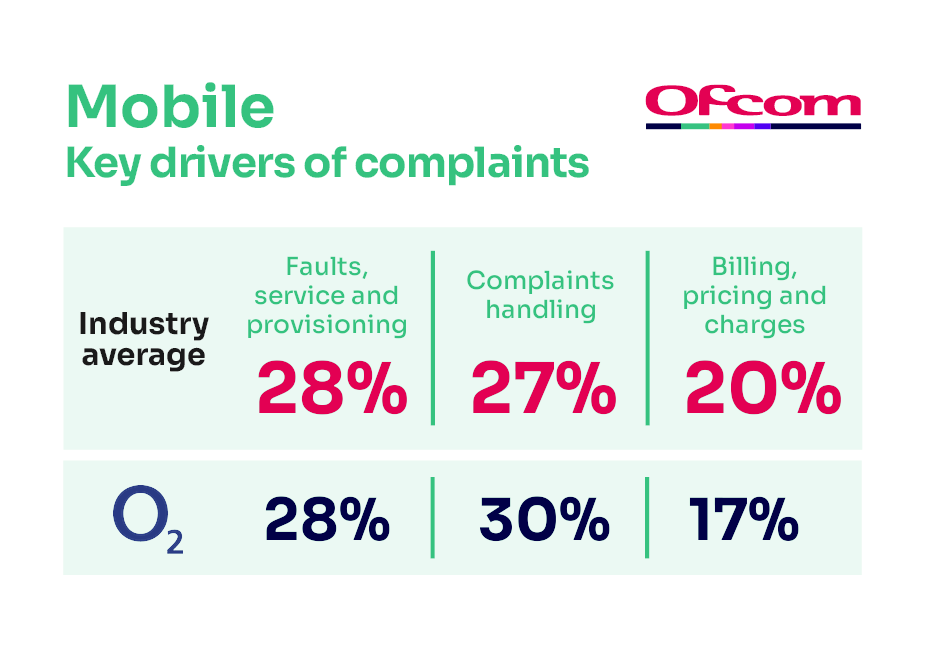
- O2 continued to be the most complained about pay-monthly mobile provider. Customer complaints were primarily driven by how their complaints were handled.
- EE, Sky Mobile and Tesco Mobile were the least complained about pay-monthly mobile providers.
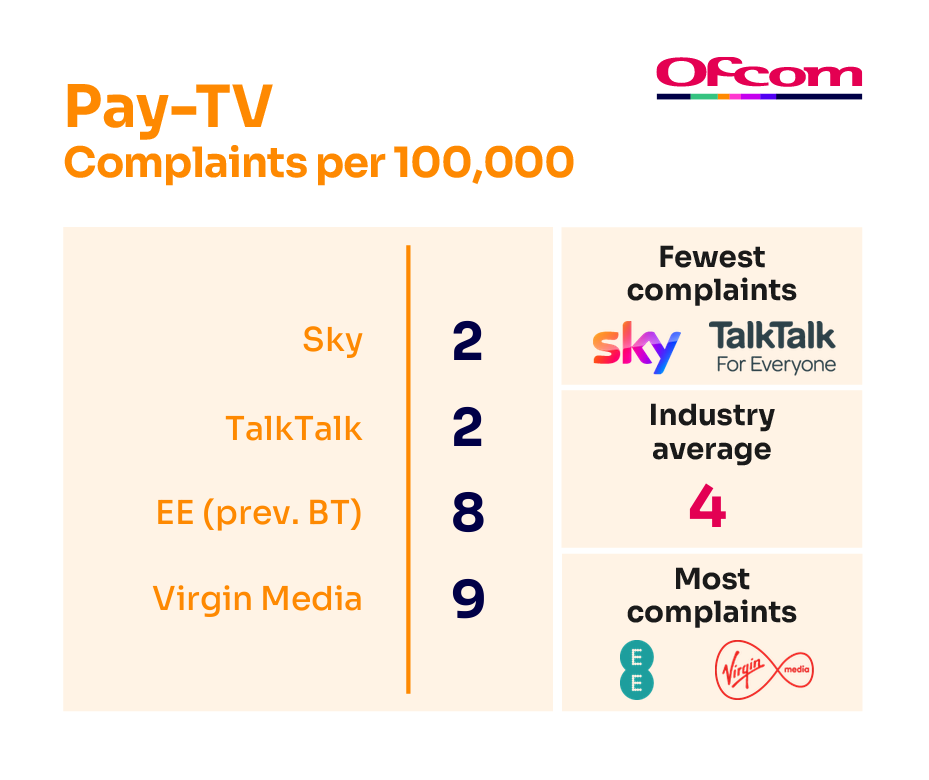
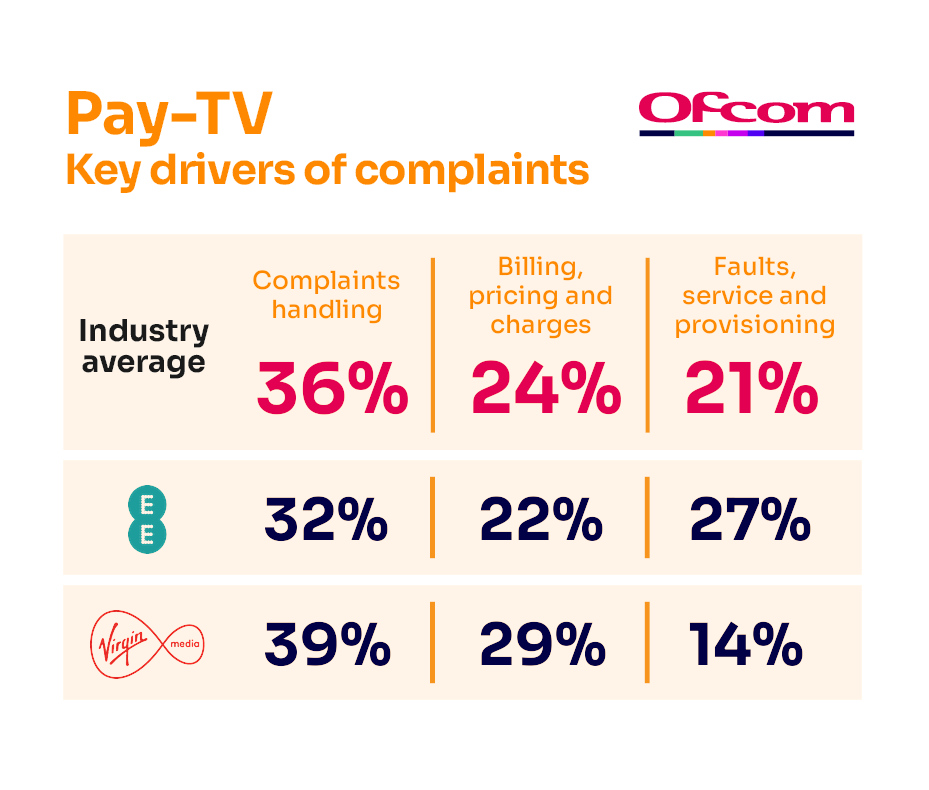
- The most complained about pay-TV providers were EE and Virgin Media.
- Sky and TalkTalk were the least complained about pay-TV providers.
See below for information about the comparability of certain providers’ number of complaints. Our background and methodology document goes into more detail.
The chart below shows the relative volume of complaints we have received for broadband, landline, pay-monthly mobile and pay-TV services. You can use the slider to filter by year.
Relative volume of complaints per 100,000 customers
Taking a year-on-year comparison, the relative volume of complaints about fixed broadband, landline, and pay-TV decreased and complaints about pay-monthly mobile stayed the same.
For the best experience, expand to full screen (click on the button in the bottom right corner).
League tables & key complaints
Fixed broadband
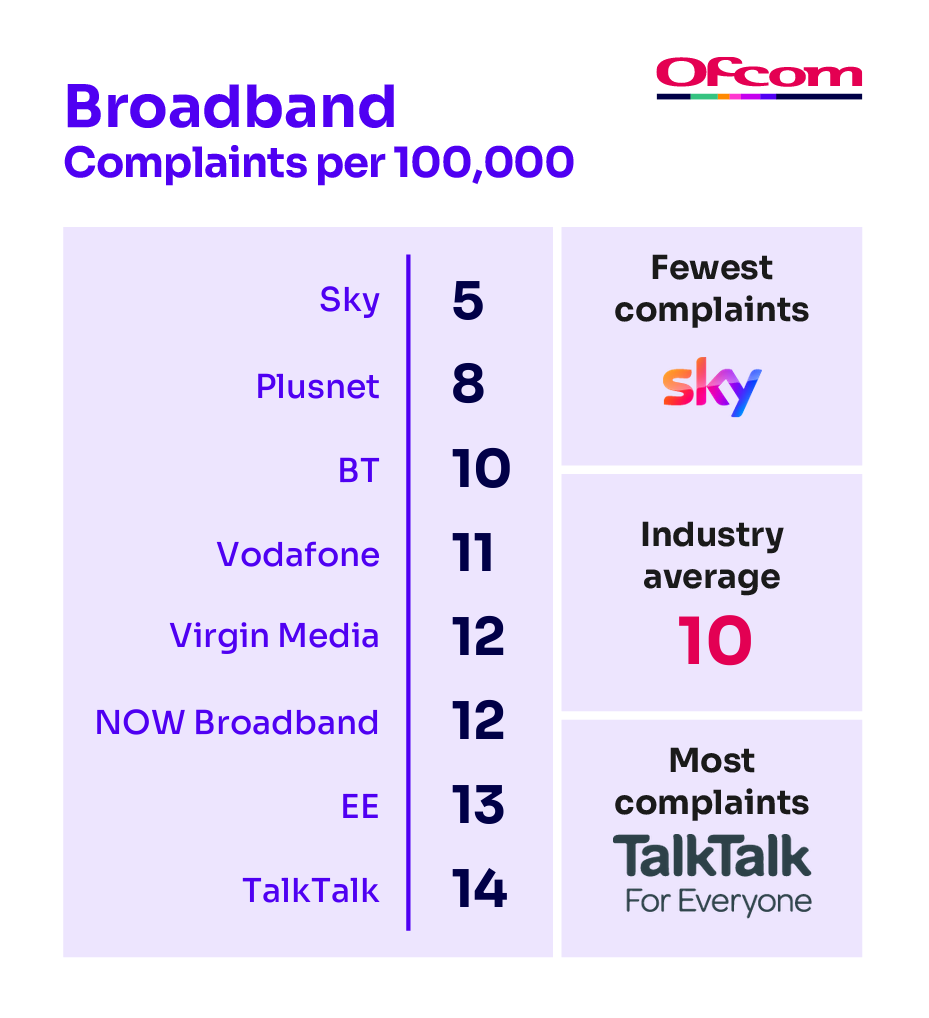
*Shell’s total number of Broadband complaints is 34. Shell and TalkTalk’s joint complaints would be 15.37 per 100,000 (8th position in the table).
Landline
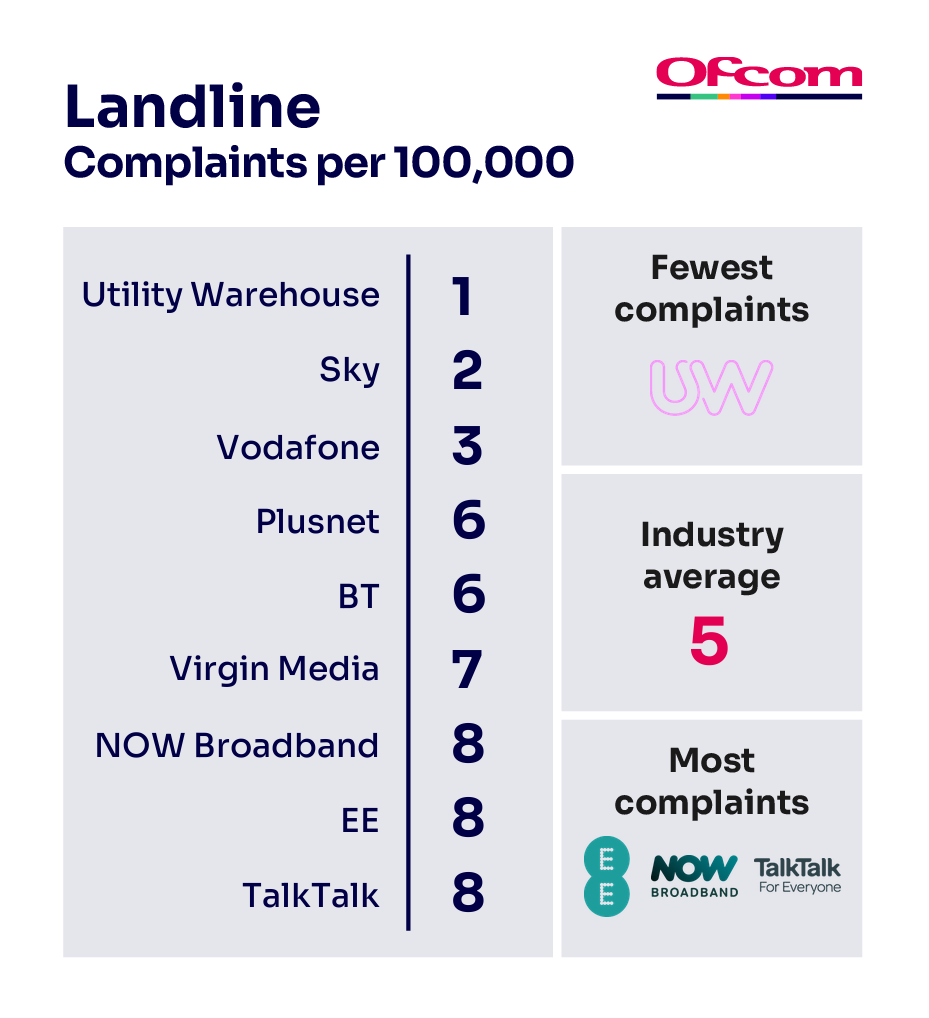
*Shell’s total number of Landline complaints is 18. Shell and TalkTalk’s joint complaints would be 9.17 per 100,000 (9th position in the table).
Pay-monthly mobile
Pay-TV
Comparability of complaints per 100,000 customers
Where the actual measurable difference between providers’ number of complaints per 100,000 customers is less than 1, we consider their results to be comparable. Within the following sectors, we consider the listed providers to be comparable:
Fixed Broadband:
- Industry Average, BT and Vodafone;
- Virgin Media, NOW Broadband and EE.
Landline:
- Industry Average and Plusnet;
- Plusnet, BT and Virgin Media;
- NOW Broadband, EE and TalkTalk.
Pay-Monthly Mobile:
- Tesco Mobile, Sky Mobile and EE;
- EE, Vodafone, iD Mobile, Industry Average and Three.
Pay-TV:
- Sky and TalkTalk;
- EE and Virgin Media.
Overall complaints by sector
The chart below shows complaints for all providers in each of the four sectors.
For the best experience, expand to full screen (click on the button in the bottom right corner).
Comparing different providers
To compare two or more providers’ performance, select the service and then the providers you want to compare from the lists on the right.
For the best experience, expand to full screen (click on the button in the bottom right corner).
Complaints by provider
Compare complaints for a provider across multiple sectors by using the options on the right.
For the best experience, expand to full screen (click on the button in the bottom right corner).
More information
The underlying data is available in CSV format. We also include overall trend data for pay-as-you-go mobile complaints.
You can also read the report’s background and methodology.
Older reports
- Telecoms and pay TV complaints Q3 2024 (PDF, 1.02 MB)
- Telecoms and pay TV complaints Q2 2024 (PDF, 922 KB)
- Telecoms and pay TV complaints Q1 2024 (PDF, 650 KB)
- Telecoms and pay TV complaints Q4 2023 (PDF, 486 KB)
- Telecoms and pay TV complaints Q3 2023
- Telecoms and pay TV complaints Q2 2023 (PDF, 654.5 KB)
- Telecoms and pay TV complaints Q1 2023
- Telecoms and pay TV complaints Q4 2022
- Telecoms and pay TV complaints Q3 2022
- Telecoms and pay TV complaints Q2 2022
- Telecoms and pay TV complaints Q1 2022
Older reports are available via the National Archives.